
Project-based learning
Build real work you can show in interviews.

 Course details
From raw data to business decisions — Python, SQL, ML & Power BI.
 Taught by Sneha Iyer · Data Analytics Mentor


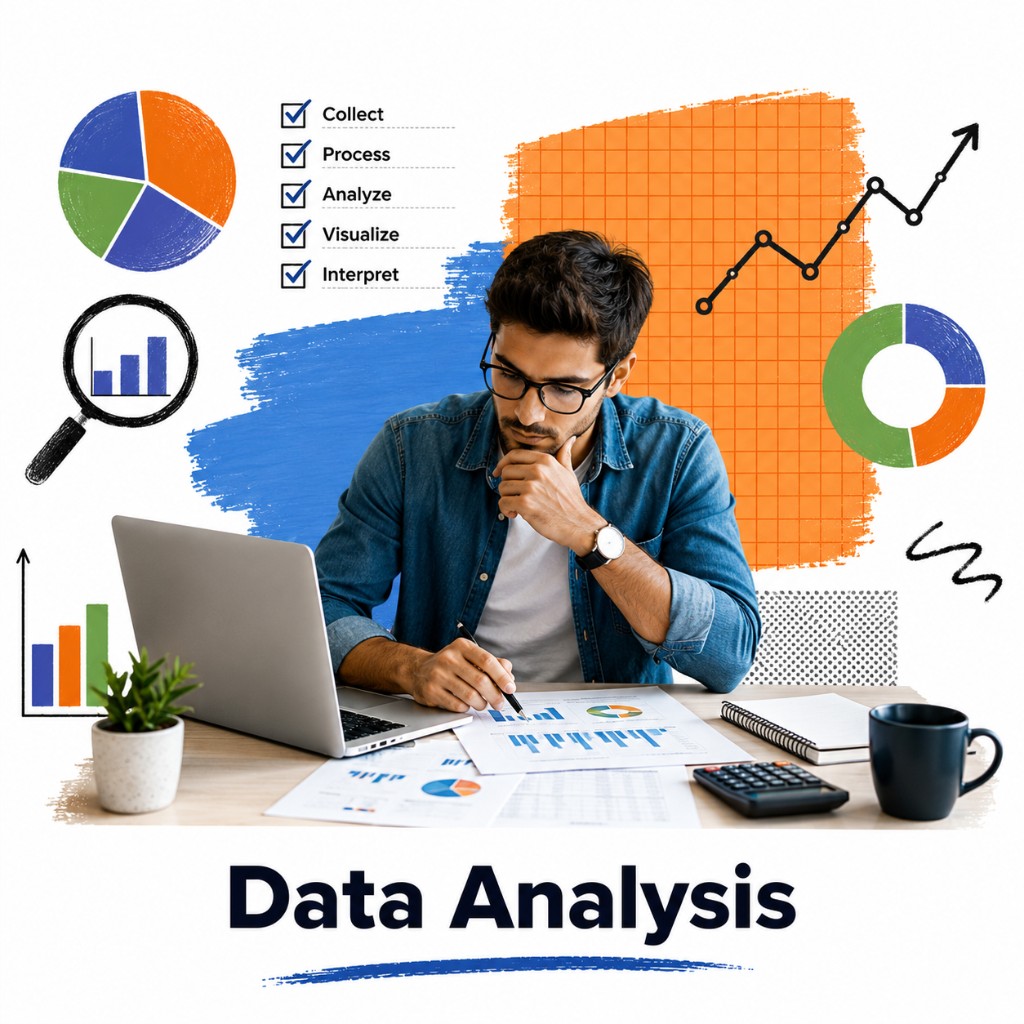
Build real work you can show in interviews.
Revisit lessons anytime after you enroll.
Learn with guidance from industry experts.
Practical modules aligned to real roles.
Overview
A 3-month professional program (12 weeks, 2–3 live classes/week). Path: Python → Data Analysis → Statistics → Machine Learning → SQL → Power BI. Hands-on labs with real datasets and an industry capstone.
Finish with practical skills and a portfolio-ready project in Data Analysis you can use for jobs, freelancing, or your next role.
Skills
Python for analytics (Pandas, NumPy)
Data analysis & statistics
Machine learning for analysts
SQL & ETL pipelines
Power BI dashboards
Career paths: Data Analyst, BI Analyst, ML Analyst, Power BI Developer
Audience
Starting Data Analysis from scratch and want a clear path.
Building a portfolio and interview-ready skills.
Upskilling into data roles with practical projects.
Before you start
Syllabus
12 modules · week-by-week topics · labs · certificate on completion
Phase 01 · Data Analysis Foundations — start with a solid Python base.
Topics covered
Lab: Setup environment & coding exercises
Process collections of data with clean, reusable Python.
Topics covered
Lab: Data processing program
Read, write, and organize external datasets safely.
Topics covered
Lab: External data processing utility
Analyse tabular data efficiently with NumPy and Pandas.
Topics covered
Lab: Real-world dataset analysis
Find patterns and communicate them with clear visuals.
Topics covered
Lab: EDA insights report
Use descriptive stats to support reliable decisions.
Topics covered
Lab: Statistical analysis & outlier detection
Phase 02 · Machine Learning & BI — prepare data for modeling.
Topics covered
Lab: Clean an ML-ready dataset
Build and evaluate regression models for business prediction.
Topics covered
Lab: Mini project: prediction system
Classify outcomes and report metrics that matter.
Topics covered
Lab: Mini project: classification system
Compare tree ensembles and pick the right approach.
Topics covered
Lab: Model comparison lab
Query relational data for analysis-ready extracts.
Topics covered
Lab: Business data queries
Ship a BI dashboard and complete the analytics capstone.
Topics covered
Lab: Interactive dashboard + capstone
Open the full Syncpedia curriculum booklet in a popup — view only, no download.
After the course
By completing this course, you will have the practical skills and a portfolio project in Data Analysis to confidently move forward in your career.
Faculty

Courses
Every lesson is hands-on, screen-shared, and built for real operators.
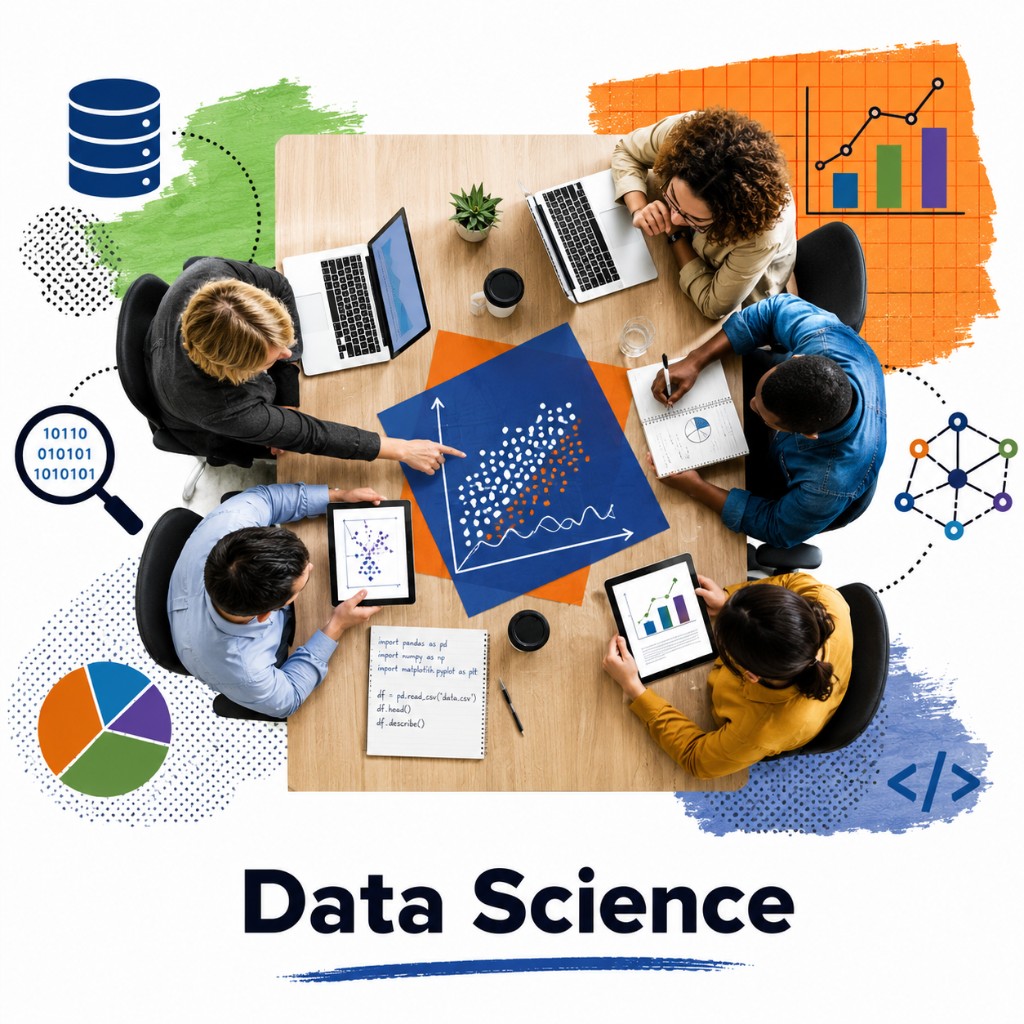

Turn raw data into insight, models, and business decisions.
Learn More →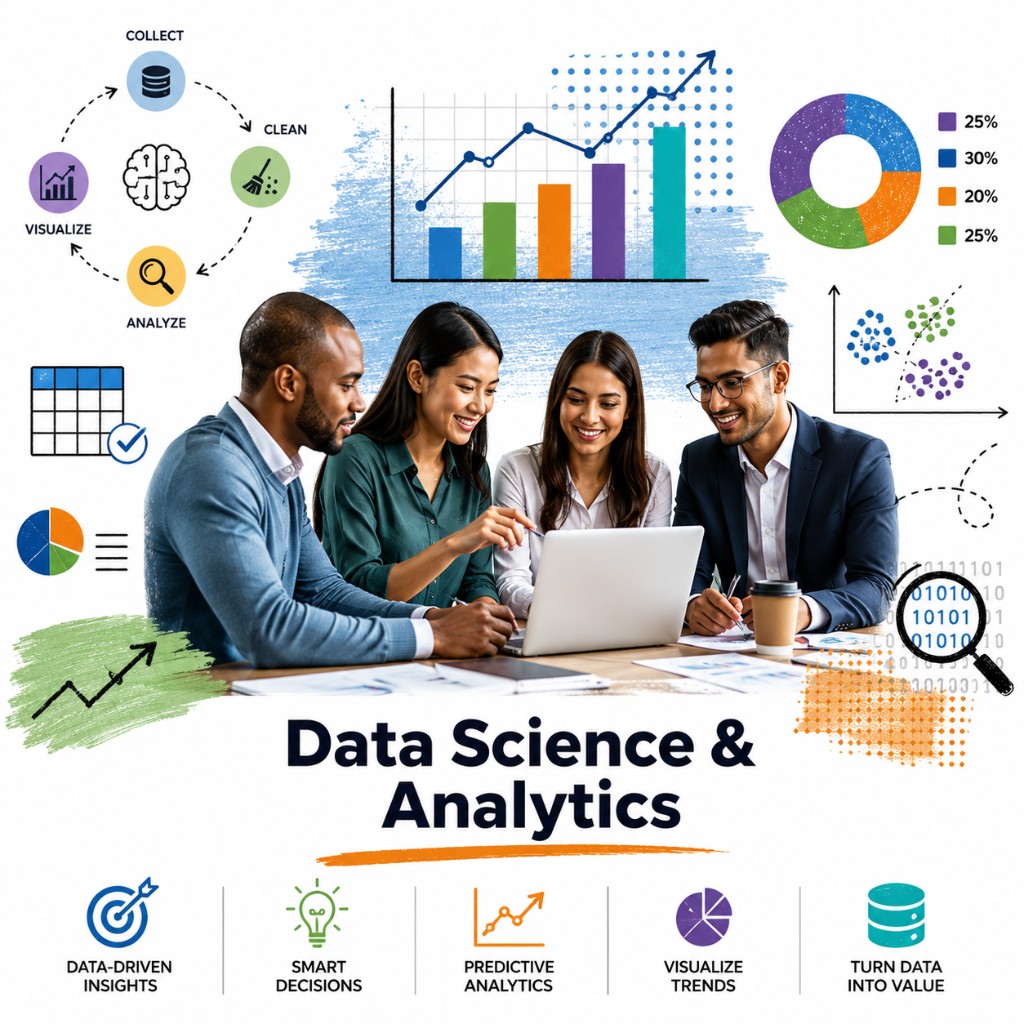
The complete path from analytics fundamentals to predictive modelling.
Learn More →
Learn. Build. Apply. Deploy. — industry-oriented AI & applied ML.
Learn More →Get In Touch
Learn new skills, grow your knowledge, and achieve your goals effortlessly every single day, anywhere, anytime.
Start Learning Free